
MiniProject | Customer Segmentation based on Lifetime Value (LTV)
Use K-Means to cluster users based on their Recency - Frequency - Monetary.

Overview
User segmentation is the process of separating users into distinct groups, or segments, based on shared characteristics. A company might segment users based on language preferences, product version, geographical region, or user persona. With thoughtful user segmentation, product teams can study how user behaviors vary between segments, then design personalized experiences for each segment. For examples: if we segment user with high customer lifetime value (very active in our platform and bring high profit for us), we could offers these users potential packages to keep their retention our platform.
There are many types of user segments such as based on their demographic, behavioral,… User segmentation based on Lifetime Value is grouping customers based on their predicted worth to the business over their entire lifecycle. With this approach, we could identify low-value, medium-value or high-value customers to optimize our resource allocation, improve customer retention.
Customer Lifetime Value (LTV) is the process by which a business measures the value of a customer to the business through the customer’s full lifespan. Lifetime value is the total revenue a company expects to earn over the lifetime of their relationship with a single customer.

The lifetime value calculate is given as:
Lifetime value = Average value of sale * Number of transactions * Retention time period
Customer lifetime value = Lifetime value * Profit margin
This project is a part of my big project Customer and Seller Analytics and Machine Learning Design System. In this mini project, I will segment users based on Customer Lifetime Value using KMeans.
Data source: Kaggle Olist Ecommerce dataset
Link code Github: Customer segmentation based on CLV
User segmentation based on Customer Lifetime Value
In this mini project, I will segment users based on Customer Lifetime Value using the RFM (Recency, Frequency, Monetary) model using method K-Means clustering. The input of my mini project is the dataset of customer orders includes unique customer ID, order_id, purchase date, money spend on every order. The output is segmenting every customer into a group (low to high LTV). Low LTV indicates user low active, low purchase frequency, low revenue to our business. In contrast, high LTV users indicates user with high active, high purchase frequency and high revenue to our business.
The main idea is to group users according to:
1/ Recency – Indicates how recently a user was active on our product. It is calculated based on the number of days since the user’s last activity. The fewer days since their last activity, the more valuable the user is.
2/ Frequency – Reflects how often a user interacts with our product, measured by the number of orders they have placed. A higher number of orders indicates a more engaged and valuable customer.
3/ Monetary (Revenue) – Represents the revenue a user brings in, calculated based on the total value of their orders. Users with higher spending are considered more valuable.
After clustering users based on Recency, Frequency, and Monetary metrics, I will calculate a combined RFM score for each user to summarize their overall value.
To prepare for this notebook, I need to import libraries and dataset
#Import libraries
import pandas as pd
import numpy as np
import matplotlib.pyplot as plt
from sklearn.cluster import KMeans
import plotly as py
import plotly.offline as pyoff
import plotly.graph_objs as go

#Import datasets
olist_customers = pd.read_csv("/Users/phuongnguyen/Documents/Code Github/mlops-ml-ecommerce-customers/sample_files/olist_dataset/olist_customers_dataset.csv")
olist_orders = pd.read_csv("/Users/phuongnguyen/Documents/Code Github/mlops-ml-ecommerce-customers/sample_files/olist_dataset/olist_orders_dataset.csv")
olist_orders_payment = pd.read_csv("/Users/phuongnguyen/Documents/Code Github/mlops-ml-ecommerce-customers/sample_files/olist_dataset/olist_order_payments_dataset.csv")
I need to merge dataset orders, customers, and their payments to get the orders and payment by unique customer ID. Just only ‘customer_unique_id’ is presented for unique customer. One customer_unique_id could have multiple orders all the time.
#merge dataset orders and customers to solve unique_customer_id
orders_bycus = pd.merge(olist_orders, olist_customers, on = 'customer_id')

#merge dataset orders by customer and their payment for further use
orders_payment_bycus = pd.merge(orders_bycus, olist_orders_payment, on = 'order_id')
Clustering user based on Recency
Firstly, I will use K-Means clustering to segment users based on user’s recency.
Get the maximum date of purchase order in all dataset. Base on the maximum date of purchase order, I will calculate how many days since the last active days of every orders by every users.
#Get the maximum date of order_purchase_timestamp to get the latest date of the order dataset
max_date = orders_payment_bycus['order_purchase_timestamp'].max()
max_date_timestamp = pd.to_datetime(max_date)

#Convert Order Purchase timestamp to_datetime for further calculation
orders_payment_bycus['purchase_timestamp'] = pd.to_datetime(orders_payment_bycus['order_purchase_timestamp'])

#Get recency of every customers
orders_payment_bycus['last_order'] = max_date_timestamp - orders_payment_bycus['purchase_timestamp']
orders_payment_bycus['recency'] = orders_payment_bycus['last_order'].dt.days

#Get the new dataframe with recency date for every customer_unique_id
olist_orders_recency = orders_payment_bycus[['customer_unique_id', 'recency']]
One user could have multiple orders, so get the min recency date by order by unique customer the get the last active days. The lower the date user active in our platform, the better value our customer.
#Filter dataframe with the same customer_unique_id, get the min recency
olist_orders_recency = olist_orders_recency.loc[olist_orders_recency.groupby('customer_unique_id')['recency'].idxmin()]
To find the optimal number of cluster, I use Elbow:
sse = {}
olist_recency = olist_orders_recency[['recency']]
for k in range(1, 10):
    kmeans = KMeans(n_clusters=k, max_iter=1000).fit(olist_recency)
    olist_recency["clusters"] = kmeans.labels_
    sse[k] = kmeans.inertia_
plt.figure()
plt.plot(list(sse.keys()), list(sse.values()))
plt.xlabel("Number of cluster")
plt.show()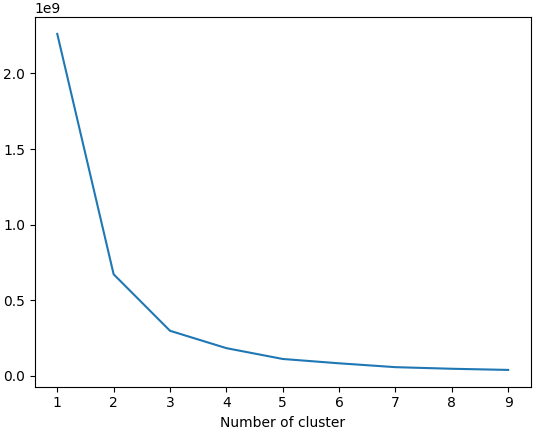
Choose the number of cluster is 4. Then I will build 4 clusters for recency and add it to our dataframe:
#Build 4 clusters for recency and add it to dataframe
kmeans = KMeans(n_clusters =4)
olist_orders_recency['recency_cluster'] = kmeans.fit_predict(olist_orders_recency[['recency']])
After building 4 clusters, using describe() to check descriptive statistics of our user segmentation:
olist_orders_recency.groupby('recency_cluster')['recency'].describe()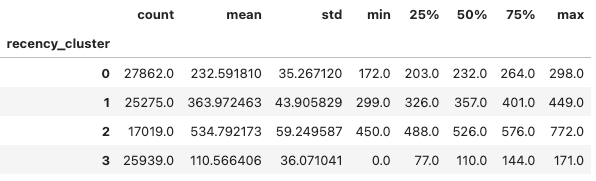
Rename cluster_name to present the order value of our users. So that, I want to reorder user of cluster 3 is better than user of cluster 1. It means that, the mean of recency days of user in cluster 3 is shorter than the the mean of recency days of user in cluster 1. User active recently is much more better, so I rename the cluster.
#reorder clusters so that cluster 3 is better than cluster 1 means that with cluster 1: the mean is longer than cluster 3
#function for ordering cluster numbers
def order_cluster(cluster_field_name, target_field_name,df,ascending):
    new_cluster_field_name = 'new_' + cluster_field_name
    df_new = df.groupby(cluster_field_name)[target_field_name].mean().reset_index()
    df_new = df_new.sort_values(by=target_field_name,ascending=ascending).reset_index(drop=True)
    df_new['index'] = df_new.index
    df_final = pd.merge(df,df_new[[cluster_field_name,'index']], on=cluster_field_name)
    df_final = df_final.drop([cluster_field_name],axis=1)
    df_final = df_final.rename(columns={"index":cluster_field_name})
    return df_final

#reorder
olist_orders_recency_ordered = order_cluster('recency_cluster', 'recency', olist_orders_recency, False)

#check descriptive after reorder
olist_orders_recency_ordered.groupby('recency_cluster')['recency'].describe()
I got the result:
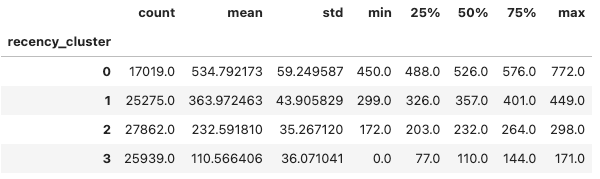
Yay! After reordering, I have the mean of recency days of user in cluster 3 (~ 110 days) is shorter than the mean of recency days of users in cluster 0 (~534 days). It means users in cluster 3 are more active than users in cluster 0.
Clustering user based on Frequency
Secondly, I will use K-Means clustering to segment users based on user’s order frequency.
How many orders does every unique customer have? I use group by to count the number of orders of every customer to present the frequency or stickiness of users with our platform.
olist_customers_frequency = orders_payment_bycus.groupby('customer_unique_id')['order_id'].nunique().reset_index()
olist_customers_frequency.columns = ['customer_unique_id', 'frequency']

#Check descriptive after counting
olist_customers_frequency.describe()
I got the result that the range of min to max number of orders is 1 to 17. Check the real data with the customer that has 17 orders. It makes more sense!
To cluster users with their frequency, I need to find the optimal number of cluster by Elbow:
#clustering customer based on their revenue
from sklearn.cluster import KMeans

sse = {}
olist_revenue = olist_customers_frequency[['frequency']]
for k in range(1, 10):
    kmeans = KMeans(n_clusters=k, max_iter=1000).fit(olist_revenue)
    olist_revenue["clusters"] = kmeans.labels_
    sse[k] = kmeans.inertia_
plt.figure()
plt.plot(list(sse.keys()), list(sse.values()))
plt.xlabel("Number of cluster")
plt.show()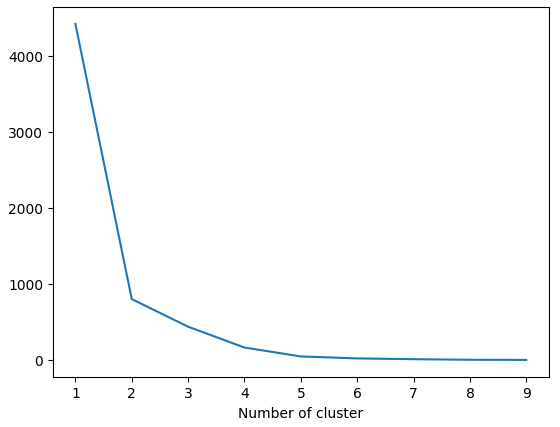
Similarly recency user clustering, I chose 4 as the number of clusters. Apply K-Means clustering algorithm:
#Apply clustering
kmeans = KMeans(n_clusters=4)
olist_customers_frequency['frequency_cluster'] = kmeans.fit_predict(olist_customers_frequency[['frequency']])

#Check descriptive
olist_customers_frequency.groupby('frequency_cluster')['frequency'].describe()
I got the result:
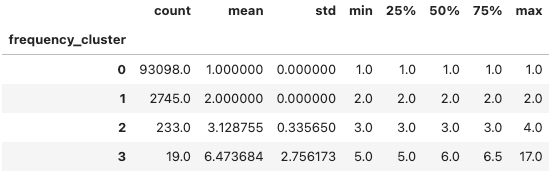
Great! Most of users have only 1 order. Just a few customers have more average orders around 6 orders per one. Similarly recency user clustering, I need to reorder to identify that user in cluster 3 is better than user in cluster 0. It means the mean of number orders of users in cluster 0 is lower than the number orders of users in cluster 3.
#reorder clusters so that cluster 3 is better than cluster 1 means that with cluster 1: the mean (frequency) is higher than the mean (frequency) of cluster 3
#function for ordering cluster numbers
def order_cluster(cluster_field_name, target_field_name,df,ascending):
    new_cluster_field_name = 'new_' + cluster_field_name
    df_new = df.groupby(cluster_field_name)[target_field_name].mean().reset_index()
    df_new = df_new.sort_values(by=target_field_name,ascending=ascending).reset_index(drop=True)
    df_new['index'] = df_new.index
    df_final = pd.merge(df,df_new[[cluster_field_name,'index']], on=cluster_field_name)
    df_final = df_final.drop([cluster_field_name],axis=1)
    df_final = df_final.rename(columns={"index":cluster_field_name})
    return df_final

#Reorder
olist_orders_frequency_ordered = order_cluster('frequency_cluster', 'frequency', olist_customers_frequency, True)

#Check again our descriptive
olist_orders_frequency_ordered.groupby('frequency_cluster')['frequency'].describe()
Great! After reordering, we have the mean of frequency of user in cluster 3 (~ 6 orders) is higher than the mean of frequency of user in cluster 0 (~534 days). It means users in cluster 3 have more purchases than users in cluster 0.
Clustering user based on Monetary - Revenue
Thirdly, I will use K-Means clustering to segment users based on user’s revenue.
How much each user has spent on our platform? I need to sum the revenue by each unique customer:
olist_customers_revenue = orders_payment_bycus.groupby(['customer_unique_id'], sort = True)['payment_value'].sum()
olist_customers_revenue = olist_customers_revenue.to_frame().reset_index()

#Rename columns
olist_customers_revenue.columns = ['customer_unique_id', 'revenue']
To cluster users with their revenue, I need to find the optimal number of cluster by Elbow:
#clustering customer based on their revenue
from sklearn.cluster import KMeans

sse = {}
olist_revenue = olist_customers_revenue[['revenue']]
for k in range(1, 10):
    kmeans = KMeans(n_clusters=k, max_iter=1000).fit(olist_revenue)
    olist_revenue["clusters"] = kmeans.labels_
    sse[k] = kmeans.inertia_
plt.figure()
plt.plot(list(sse.keys()), list(sse.values()))
plt.xlabel("Number of cluster")
plt.show()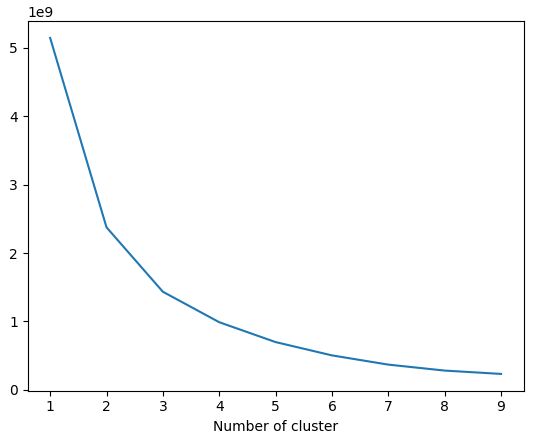
Similarly recency user clustering, I chose 4 as the number of clusters. Apply K-Means clustering algorithm:
#apply clustering
kmeans = KMeans(n_clusters=4)
olist_customers_revenue['revenue_cluster'] = kmeans.fit_predict(olist_customers_revenue[['revenue']])

#check descriptive
olist_customers_revenue.groupby('revenue_cluster')['revenue'].describe()
I got the result:
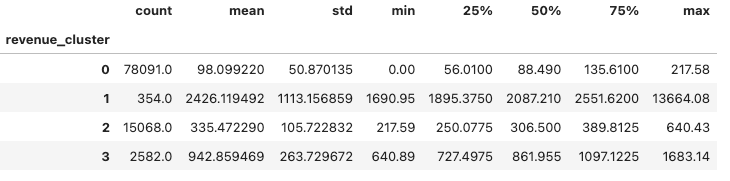
I need to reorder to distinguish that user in cluster 3 is better than user in cluster 0. It means the revenue of number orders of users in cluster 0 is lower than the revenue of users in cluster 3.
#reorder clusters so that cluster 3 is better than cluster 1 means that with cluster 1: the mean (frequency) is higher than the mean (frequency) of cluster 3
#function for ordering cluster numbers
def order_cluster(cluster_field_name, target_field_name,df,ascending):
    new_cluster_field_name = 'new_' + cluster_field_name
    df_new = df.groupby(cluster_field_name)[target_field_name].mean().reset_index()
    df_new = df_new.sort_values(by=target_field_name,ascending=ascending).reset_index(drop=True)
    df_new['index'] = df_new.index
    df_final = pd.merge(df,df_new[[cluster_field_name,'index']], on=cluster_field_name)
    df_final = df_final.drop([cluster_field_name],axis=1)
    df_final = df_final.rename(columns={"index":cluster_field_name})
    return df_final

#Reorder
olist_orders_frequency_ordered = order_cluster('frequency_cluster', 'frequency', olist_customers_frequency, True)

#Check again our descriptive
olist_orders_frequency_ordered.groupby('frequency_cluster')['frequency'].describe()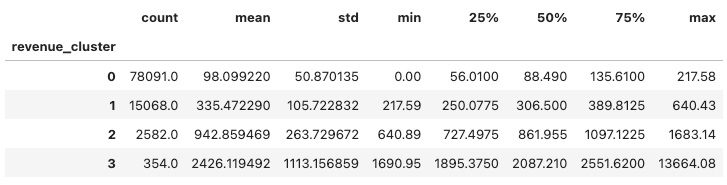
Great! After reordering, we have the mean of revenue of user in cluster 3 (2426$) is higher than the mean of revenue of user in cluster 0 (98$). It means users in cluster 3 have more purchases than users in cluster 0.
Overall score of Recency-Frequency-Monetary
Finally, I merge dataset unique user cluster by their recency - frequency - monetary:
#Merge recency-frequency-monetary clustering value to see details
order_rfm = pd.merge(olist_orders_recency_ordered, olist_orders_frequency_ordered, on = 'customer_unique_id')
order_rfm = pd.merge(order_rfm, olist_orders_revenue_ordered, on = 'customer_unique_id')
order_rfm.head(5)
Because each customer has their own rank of cluster in recency, frequency, monetary. The higher of score of cluster presents the better of our customer. I sum up score of each cluster in recency, frequency, monetary:
order_rfm['rfm_score'] = order_rfm['recency_cluster'] + order_rfm['frequency_cluster'] + order_rfm['revenue_cluster']

#Check mean()
order_rfm.groupby('rfm_score')[['recency', 'frequency', 'revenue']].mean()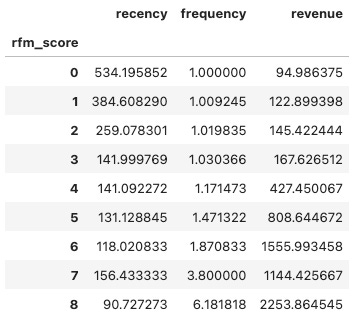
As we can see, with rfm_score = 0 is our worst customer (low active user, low number of order, low revenue). rfm_score = 8 is our beloved customer (very active user, high number of orders, high revenue)
To segment users into 3 groups: Low-Value, Mid-Value, High-Value. I base mostly on revenue to segment their groups. So that the gap of revenue of user with rfm_score 3 is distinctive with user with rfm_score 4. And the gap of revenue of user with rfm_score 5 is distinctive with user with rfm_score 6.
#Segment user with Low-value, Mid-value, High-value. I segment based mainly on Revenue first
order_rfm['Segment'] = 'Low-Value'
order_rfm.loc[order_rfm['rfm_score']>3,'Segment'] = 'Mid-Value'
order_rfm.loc[order_rfm['rfm_score']>=6,'Segment'] = 'High-Value' 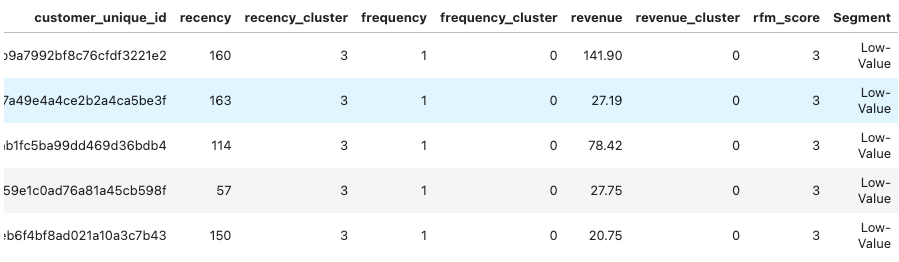
Yay! I could segment every user with the low-medium-high value to our platform.
References
User segmentation: https://www.pendo.io/glossary/user-segmentation/
Kaggle notebook: https://www.kaggle.com/code/shailaja4247/customer-lifetime-value-prediction